1
2
3
4
5
6
7
8
9
10
11
12
13
14
15
16
17
18
19
20
21
22
23
24
25
26
27
28
29
30
31
32
33
34
35
36
37
38
39
40
41
42
43
44
45
46
47
48
49
50
51
52
53
54
55
56
57
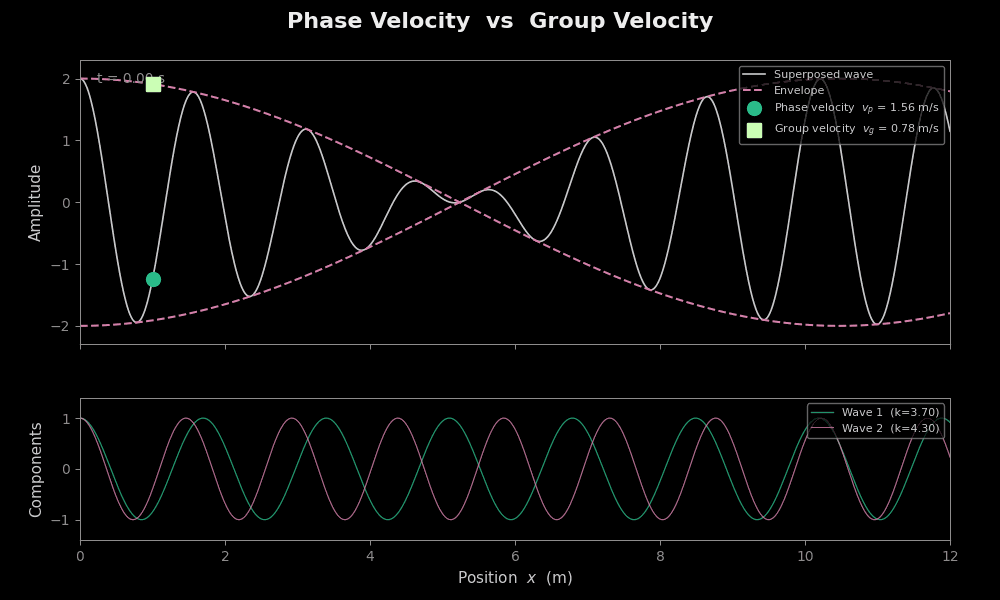
| import numpy as np
import matplotlib.pyplot as plt
from matplotlib.animation import FuncAnimation, PillowWriter
from pathlib import Path
g = 9.81
k0 = 4.0
dk = 0.3
k1, k2 = k0 - dk, k0 + dk
omega1 = np.sqrt(g * k1)
omega2 = np.sqrt(g * k2)
v_phase = (omega1 + omega2) / (k1 + k2)
v_group = (omega2 - omega1) / (k2 - k1)
x = np.linspace(0, 12, 2000)
fps = 30
n_frames = int(6.0 * fps)
fig, (ax1, ax2) = plt.subplots(2, 1, figsize=(10, 6), sharex=True,
gridspec_kw={"height_ratios": [2, 1]})
fig.suptitle("Phase Velocity vs Group Velocity", fontsize=16, fontweight="bold")
line_wave, = ax1.plot([], [], lw=1.2, label="Superposed wave")
line_env_pos, = ax1.plot([], [], lw=1.5, ls="--", color="red", label="Envelope")
line_env_neg, = ax1.plot([], [], lw=1.5, ls="--", color="red")
marker_phase, = ax1.plot([], [], "o", color="green", ms=10,
label=f"Phase vel = {v_phase:.2f} m/s")
marker_group, = ax1.plot([], [], "s", color="orange", ms=10,
label=f"Group vel = {v_group:.2f} m/s")
ax1.set_ylim(-2.3, 2.3); ax1.legend(fontsize=8)
line_w1, = ax2.plot([], [], lw=0.9, alpha=0.8, label=f"Wave 1 (k={k1:.2f})")
line_w2, = ax2.plot([], [], lw=0.9, alpha=0.8, label=f"Wave 2 (k={k2:.2f})")
ax2.set_ylim(-1.4, 1.4); ax2.legend(fontsize=8)
ax2.set_xlabel("x (m)")
phase_x0 = 1.0
def animate(frame):
t = frame / fps
y1 = np.cos(k1*x - omega1*t)
y2 = np.cos(k2*x - omega2*t)
y = y1 + y2
env = 2*np.cos(dk*x - 0.5*(omega2-omega1)*t)
line_wave.set_data(x, y)
line_env_pos.set_data(x, env)
line_env_neg.set_data(x, -env)
line_w1.set_data(x, y1); line_w2.set_data(x, y2)
xp = (phase_x0 + v_phase*t) % x[-1]
marker_phase.set_data([xp], [np.interp(xp, x, y)])
xg = (phase_x0 + v_group*t) % x[-1]
marker_group.set_data([xg], [np.interp(xg, x, env)])
anim = FuncAnimation(fig, animate, frames=n_frames, interval=1000/fps, blit=False)
anim.save("group_phase_velocity.gif", writer=PillowWriter(fps=fps))
|